Drivers of the Australian Residential Property Market Juggernaut, past, present and future
Introduction
James Whelan, Managing Director of Barclay Pearce Capital’s Wealth Management Team, recently hosted HOPE Housing on the Ensombl Investment Podcast to discuss key drivers of the Residential Real Estate market, and how investors can access new investment models. This article builds on that conversation and is the second of a series of two analysing the Australian residential property market and explores the investable opportunities advisers can make available to their clients.
Australian housing market overview
Before we investigate the key drivers of housing price growth in Australia, it’s important to understand the scale of the Australian housing market (as an asset class). As of May 2024, the value of residential property totalled $10.7 trillion1 . As any key market observer will have noted the market is on the rise and that number will no doubt be even higher today.
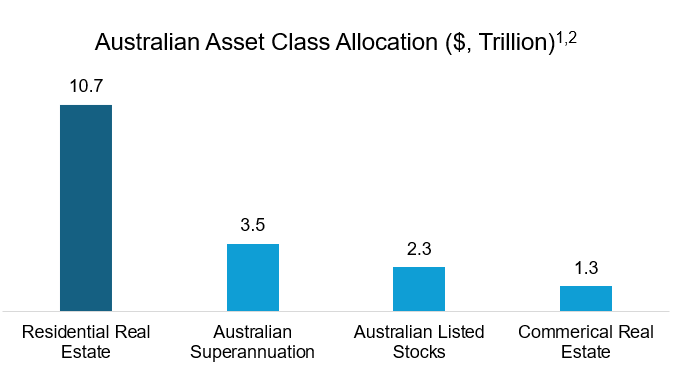
If we compare residential real estate with other well-known asset classes and sectors, we can see that it is roughly:
• 3 times as large as the superannuation sector;
• 4.5 times as big as the ASX; and
• 8 times the Commercial Real Estate asset class.2
The fact is residential real estate is systemically important to the Australian economy. 70% of Australia’s household wealth is tied to property and many of Australia’s banks still overwhelmingly rely on mortgages as their main source of business. Approximately 60% of CBA and Westpac’s loan book is comprised of mortgages.3
Part of what drives this is that owning the family home is well recognised by government as the third pillar of Australia’s retirement system, alongside superannuation and the pension. Startlingly, the federal government’s Retirement Income Review found that over 60% of single renter retirees live in poverty.4
It should therefore come as no surprise that owning a home, as soon as is feasible, is baked into the national psyche. It is an integral part of saving and preparing for retirement, not to mention providing significant psychological security during the years spent raising a family and providing accommodation stability for Australians.
Long term drivers of residential property growth
There is a lot of commentary on what shapes the housing market in Australia – much politically motivated, or short-term in nature.
The Australian property market was a hot topic of the budget and will be a key discussion point coming into the federal election.
Individually, we all tune into the RBA rate announcements and pour over the Governor’s post rate announcement to divine where the RBA might move rates next – up, down, or higher for longer? Many pundits have argued that the relative level of interest rates drive (or dampen) Australian residential house prices. However, the chart below highlights there is little evidence of this.5
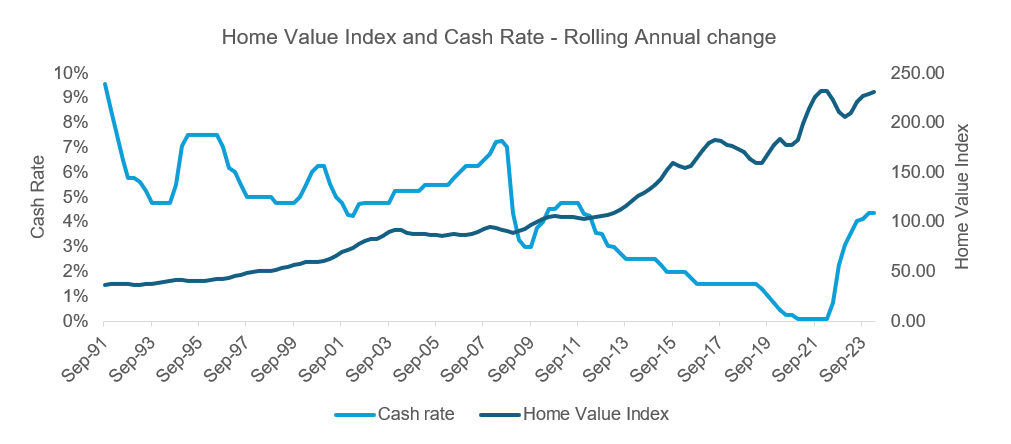
Having just lived through the experiment of rising interest rates, we can safely put to rest the idea that the two are correlated.
From our research, we will present four key macroeconomic factors or “megatrends” that drive long term growth in Australian residential property.
These trends are some of the things that fund managers (as professional property investors) are thinking about, and something that you can be discussing with your clients as well.
The four key drivers are – (i) high population growth, (ii) high urbanisation / low densification, (iii) new build approvals, (iv) capital vs. yield, and we’ll unpack each of these in this paper.
High population growth
High population growth, driven by migration, has been the norm in Australia for decades. The average population growth rate for the 20 years to 2022 in Australia was 1.4%. At a first pass this may not seem like a significantly high number, so let’s look at some comparisons.
In a global context, population growth rates in Australia are much higher than most developed countries. For example, in the same 20-year period – New Zealand grew at 1.1%, the US grew at 0.9% and the UK at 0.4%. That is 50% more than the US and more than three times the UK.
In recent years, the Australian population growth rate has hit fresh highs, driven by net overseas migration. With people migrating for career opportunities, access to great healthcare and a superior education system there is little evidence to suggest that this growth rate will not continue.
Based on Federal Budget forecasts – that net overseas migration will be halved from 528,000 in 2022–23 to 260,000 in 2024-25, with a reduction to 255,000 in 2025–26. That said, these forecast numbers, will still be above the 10-year average in the period prior to Covid, as can be seen in the chart below.
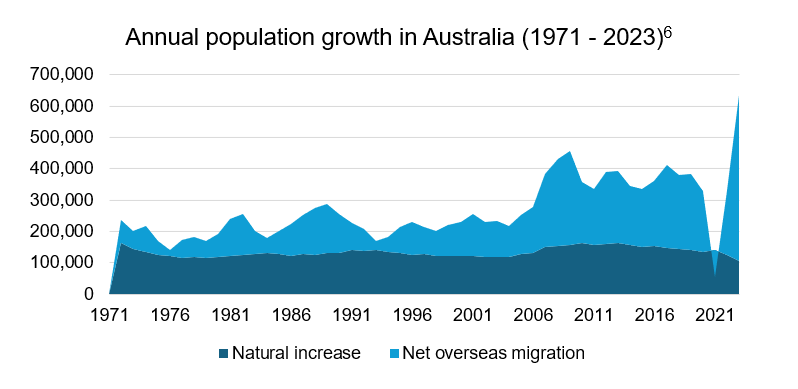
And, while there are mooted changes to the intake of international students, this is likely to have an impact on student accommodation providers more so than the broader residential property market.
High urbanisation combined with low densification
Australia’s population is unusually concentrated, with most Australians living in a small number of large cities. People are attracted to urban centres and are willing to pay more to be near to jobs and amenities.
Eastern seaboard capital cities (Sydney, Melbourne and Brisbane) contain the majority of the Australian population. As of the 2021 census, 50% of the Australian population lives in these three cities, and according to forecast, over the next 30 years the proportion of Australia’s population in these cities is expected to further increase to 57%.
This level of urbanisation contrasts shapely with the UK, where the same 50% is spread over 9 cities and the US where the number is 37 cities.
Further, Australia is not just a country of largely coastal hugging towns. Within Australian population centres, people are spread over a larger geographical space than global peers. The chart below highlights the comparatively low density.
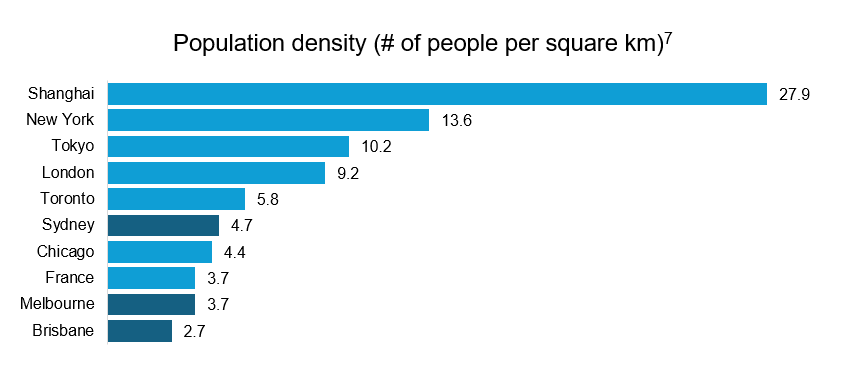
Across Sydney, Melbourne and Brisbane the population density ranges from 2.7 – 4.7 people per square km. By comparison, London has 9.2 people per square km – about twice that of Sydney, and New York has 13.6 – about three times that of Sydney.
New build approvals
While we have labelled the third driver – ‘New Build Approvals’, more importantly than the approvals, what we have seen is that dwelling approvals don’t always equate to dwelling completions – as can be seen in the gap between the orange and blue lines in the chart below.
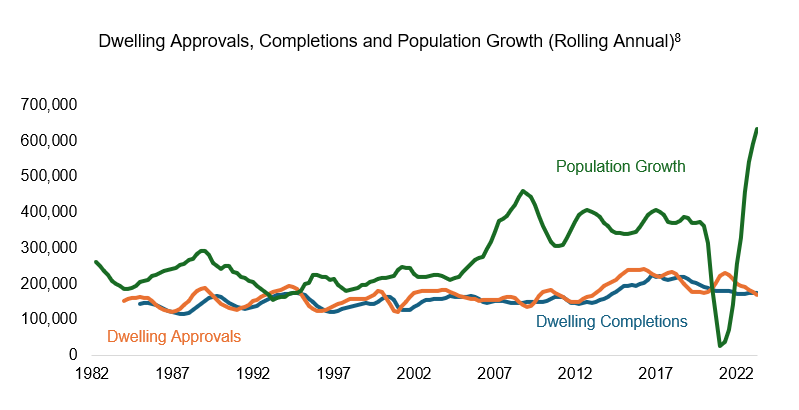
To add to this, there had been a multi-decade decline in the average number of people living in an individual home. From 2.8 in the mid-1980s to 2.5 today, which has the effect of creating extra demand for dwellings.
Analysis of Australian Bureau of Statistics data by KPMG found that as of December 31, 2023, over 37,000 dwellings were approved but had not yet commenced construction – a 9 per cent increase on the five-year average. The construction lag is most acute in high-density construction, a crucial sector because of its ability to deliver housing at scale.
Currently, almost two-thirds of approved but not yet commenced dwellings are townhouses and apartments. These higher density building types make up 80 per cent of the nearly 18,000 stalled dwellings in Sydney and Melbourne. Based on Australia’s average household size of 2.5 people, these stalled dwellings could accommodate close to 100,000 people if completed – nearly equivalent to the populations of regional towns like Ballarat or Toowoomba.
Capital growth vs. rental yield
The key point to note here is – Australia’s residential property market is characterised by high capital growth, and low rental yields. Specifically, the gross yield in key eastern seaboard cities, according to CoreLogic, as of October 2023 are:
• 3.0% in Sydney
• 3.4% in Melbourne
• 4.0% in Brisbane
Conversely, Australia has some of the highest capital growth rates among global peers. And the core issue here is that Australian rental yields have not kept up with the increases in property value.
Nationally, average gross house rental yields have fallen from 4.0% in 2012 to 3.5% in June 2022 and unit rental yields have fallen from 4.6% to 4.1% during the same period.
The chart below, illustrates the capital growth / yield trade off within the Sydney property market, and the different return profiles of units and houses.
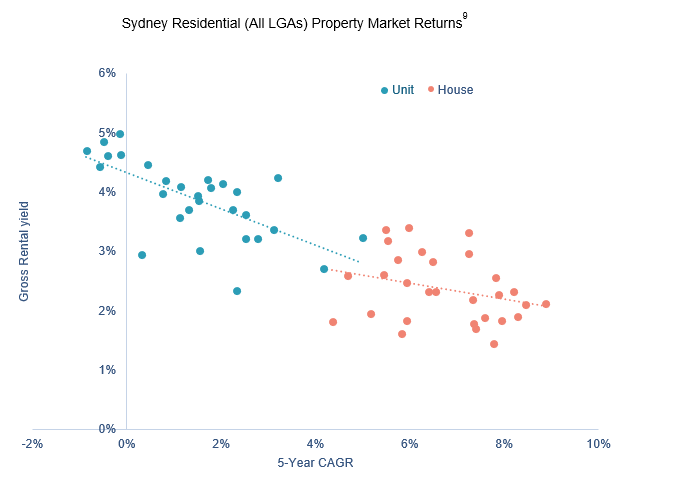
Unpacking this chart in a bit more detail – this is a scatter plot of properties by Local Government Area (LGA) in Sydney. With units in blue on the left, and houses in orange on the right.
By choosing between units and houses, a buyer is making a trade-off between capital growth – as shown on the horizontal axis and gross rental yield – as shown on the vertical axis.
Accessing residential property growth at scale
It’s important to note that the four key drivers above play out at an aggregate level. However, this is no guarantee that an investor will acquire an individual high performing asset. So, just blindly investing into residential property without using these drivers to influence where, when and how you buy won’t necessarily secure you the best return.
Rather than grappling with the macroeconomic dynamics influencing the Australian residential property sector, HOPE Housing has strategically positioned itself to capitalise on the trajectory of capital appreciation. This innovative organisation offers a unique co-investment solution tailored for essential workers seeking homes within close proximity to their workplaces. HOPE Housing enables equity investments of up to 50% of a property’s value, effectively bolstering the homeowner’s deposit and mortgage.
Moreover, HOPE Housing provides an opportunity to access the residential real estate market at scale, while sidestepping the intricacies typically associated with the traditional landlord model.
Visit our website to learn more about how HOPE Housing is creating a better way to invest in residential real estate.
DISCLAIMER
The information in this article was finalised in July 2024. This article has been prepared by HOPE Housing Fund Management Limited (HOPE) ACN 629 589 939 (Investment Manager/Manager/Company/HOPE/HOPE Housing) for general information purposes only, without taking into account your personal objectives, financial situation or needs. Before acting on this general information, you must consider its appropriateness having regard to your own objectives, financial situation and needs. The information provided is not intended to replace or serve as a substitute for any accounting, tax or other professional advice, consultation or service and nothing in this article shall be construed as a solicitation to buy or sell any financial product, or to engage in or refrain from engaging in any transaction. The Investment Manager is a corporate authorised representative (number 001289514) of SILC Fiduciary Solutions Pty Ltd ACN 638 984 602 (AFS licence number 522145). The authority of the Investment Manager is limited to general advice and deal by arranging services to wholesale clients relating to the Fund in Australia only.
Past performance should not be taken as an indication or guarantee of future performance and no representation or warranty, express or implied, is made regarding future performance. Economic conditions may change.
The analysis provided in this article is based on information obtained from sources believed to be reliable but HOPE does not make any representation or warranty that it is accurate, complete or up to date. HOPE accepts no obligation to correct or update the information or opinions in it. Any opinions expressed in this article are subject to change without notice. No member of HOPE accepts any liability whatsoever for any direct, indirect, consequential, or other loss arising from any use of such information.
REFERENCES
1. CoreLogic, Monthly Housing Chart Pack, May 2024
2. ASFA, ASX, January 2024
3. https://www.abc.net.au/news/2024-05-09/ian-verrender-mortgage-brokers-eating-bank-profits/103821972
4. https://treasury.gov.au/publication/p2020-100554
5. Source: CoreLogic Hedonic Home Value Index (2009 = baseline year, where index =100) | RBA
6.ABS, Annualised rates to June quarter
7. https://luminocity3d.org/WorldPopDen/#8/51.880/4.883
8. ABS
9. Source: CoreLogic | 5-year period is November 2018 – November 2023
