Income protection (IP) policies have traditionally been structured with a benefit period that covers the client from the time a successful claim period begins, right through to their 65th birthday (TA65).
However, our AIA Australia (AIAA) new business data tells us that advisers are increasingly recommending the alternative of a shorter 5-year benefit period, in large part due to its cost-effectiveness amid rising inflation and surging cost-of-living pressures.
In this article, we look at some of the reasons advisers are starting to more actively consider shorter benefit periods and the all-important interplay with best interests duty obligations.
What are the trade-offs?
A shorter IP benefit period might be more affordable for the client, but there’s a key trade-off. As many readers will recognise, the risk of a shorter IP benefit period is that the client might still be on claim at the end of 5 years.
To control for this risk, many advocate for an appropriate level (see case study below) of total and permanent disability (TPD) cover, alongside the IP, as protection for illnesses that evolve into more enduring and permanent ailments. That way, if the client is totally disabled at the end of 5 years, the TPD policy is likely to be payable and inject capital into the family balance sheet that could support a long-term income stream through to age 65.
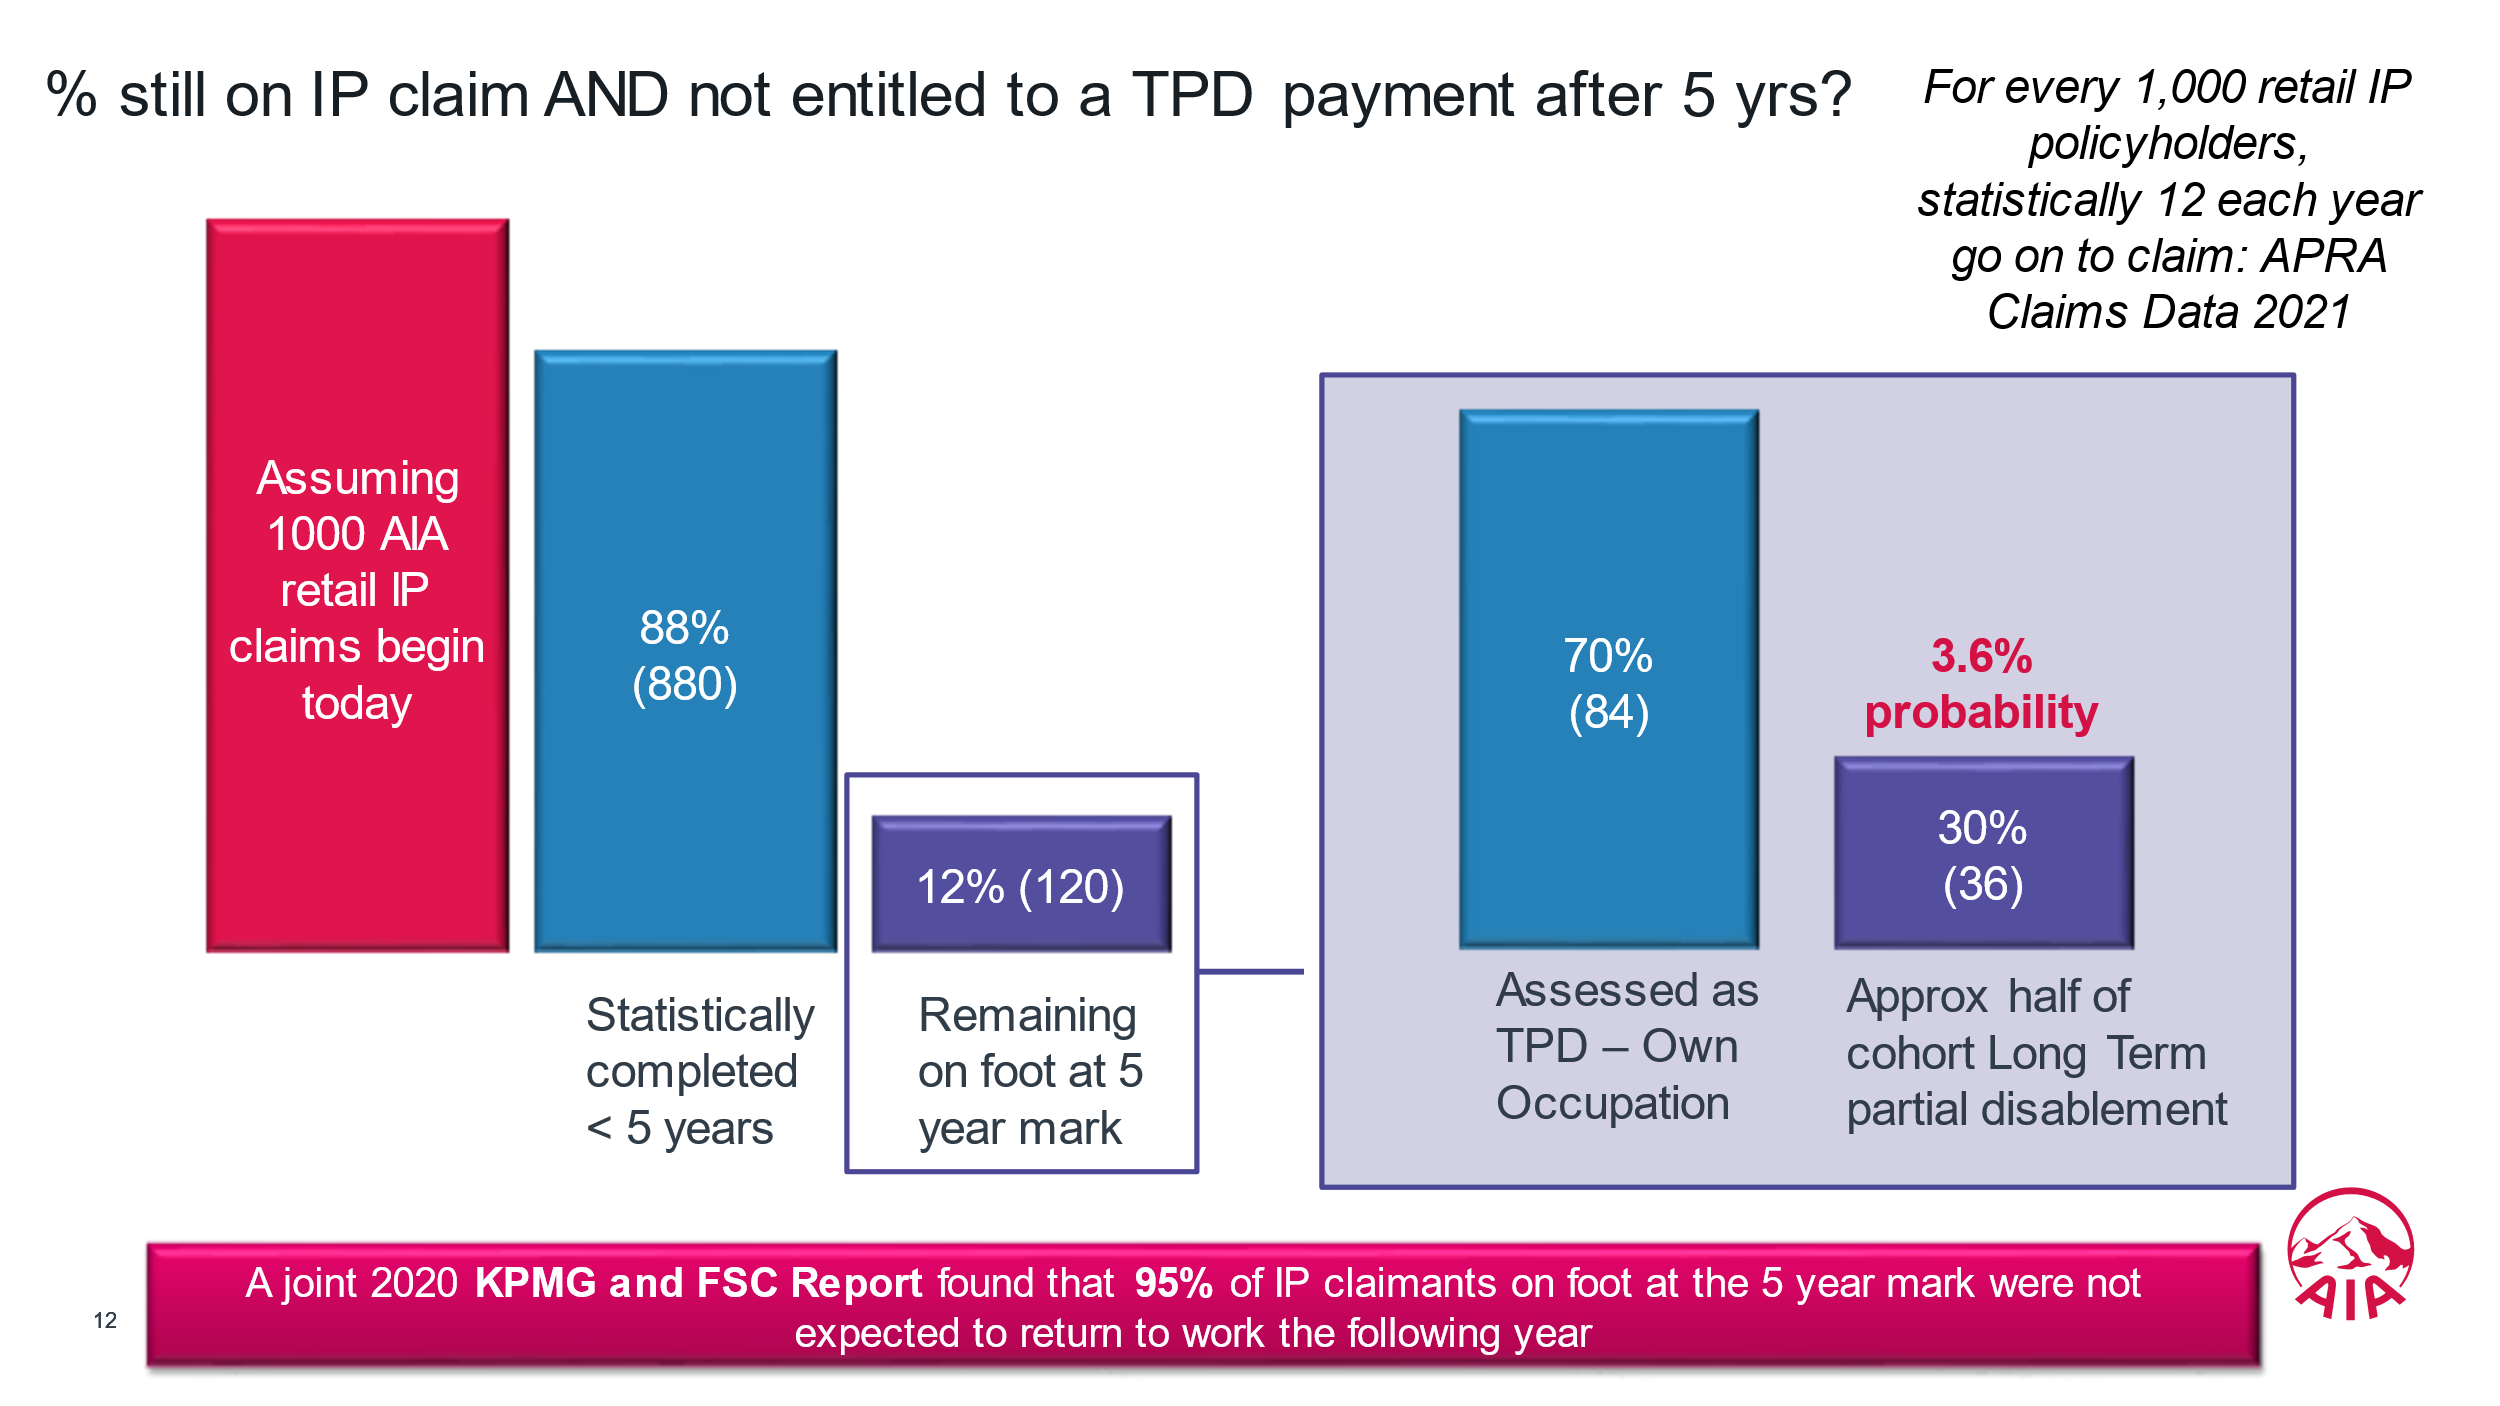
That being said, even with this dual IP/TPD setup, risks prevail. Based on AIAA’s historical IP claims experience and ongoing back testing of the retail IP book, we have quantified this risk at a 3.6% probability (Graph A below breaks down this statistical analysis). Our Claims and Actuarial teams have concluded that there is a 3.6% probability of an IP claimant still being on claim at the end of 5 years and being ineligible for a TPD own occupation payment. AIAA’s back testing has closely matched the findings of a joint 2020 KPMG and FSC Report which found that 95% of IP claimants on foot at the 5-year mark were not expected to return to work the following year.
Graph A
Balancing client objectives with the IP policy
With the discussion on what drives retention issues within an adviser’s practice, and the competing goals and objectives that advisers are typically balancing for clients, we’re seeing an increasing number of advisers view this 3.6% probability through the prism of:
- the extra annual disposable income being garnered for the client,
- how this extra income can be utilised given prevailing economic conditions and underlying client goals/objectives, and
- the enduring ‘own occupation’ definition of total and partial disablement that is typically built into these 5-year IP benefit period policies.
For example, advisers are telling us that many clients are willing to take on this 3.6% chance, especially once they discover how much they can save in annual premiums (in some cases up to 65% per annum – see Table A1 and A2 below). For clients, this lower premium means a decreased hip pocket cost for the IP cover, extra annual disposable income, and cash buffers to support paying down debt in a rising interest rate environment.
In practice with clients paying down a mortgage, we’re seeing the 5-year Benefit Period construct being positioned, alongside the traditional TA65 option as “a shorter IP benefit period that comes with a 3.6% probability/risk factor. However, if you are prepared to tolerate this, the upside is that it will provide you and your family with more disposable income each year to meet the higher actual and forecast minimum monthly home loan repayments stemming from recent interest rate rises.” Table B below illustrates the effectiveness of extra home loan repayments and quantifies the pre-tax interest savings across respective marginal tax rates, which of course is the true cost of servicing non-deductible debt.
With this in mind, it’s important to record, document, and create file notes evidencing the client discussion, and have it reinforced in the Statement of Advice (SOA).
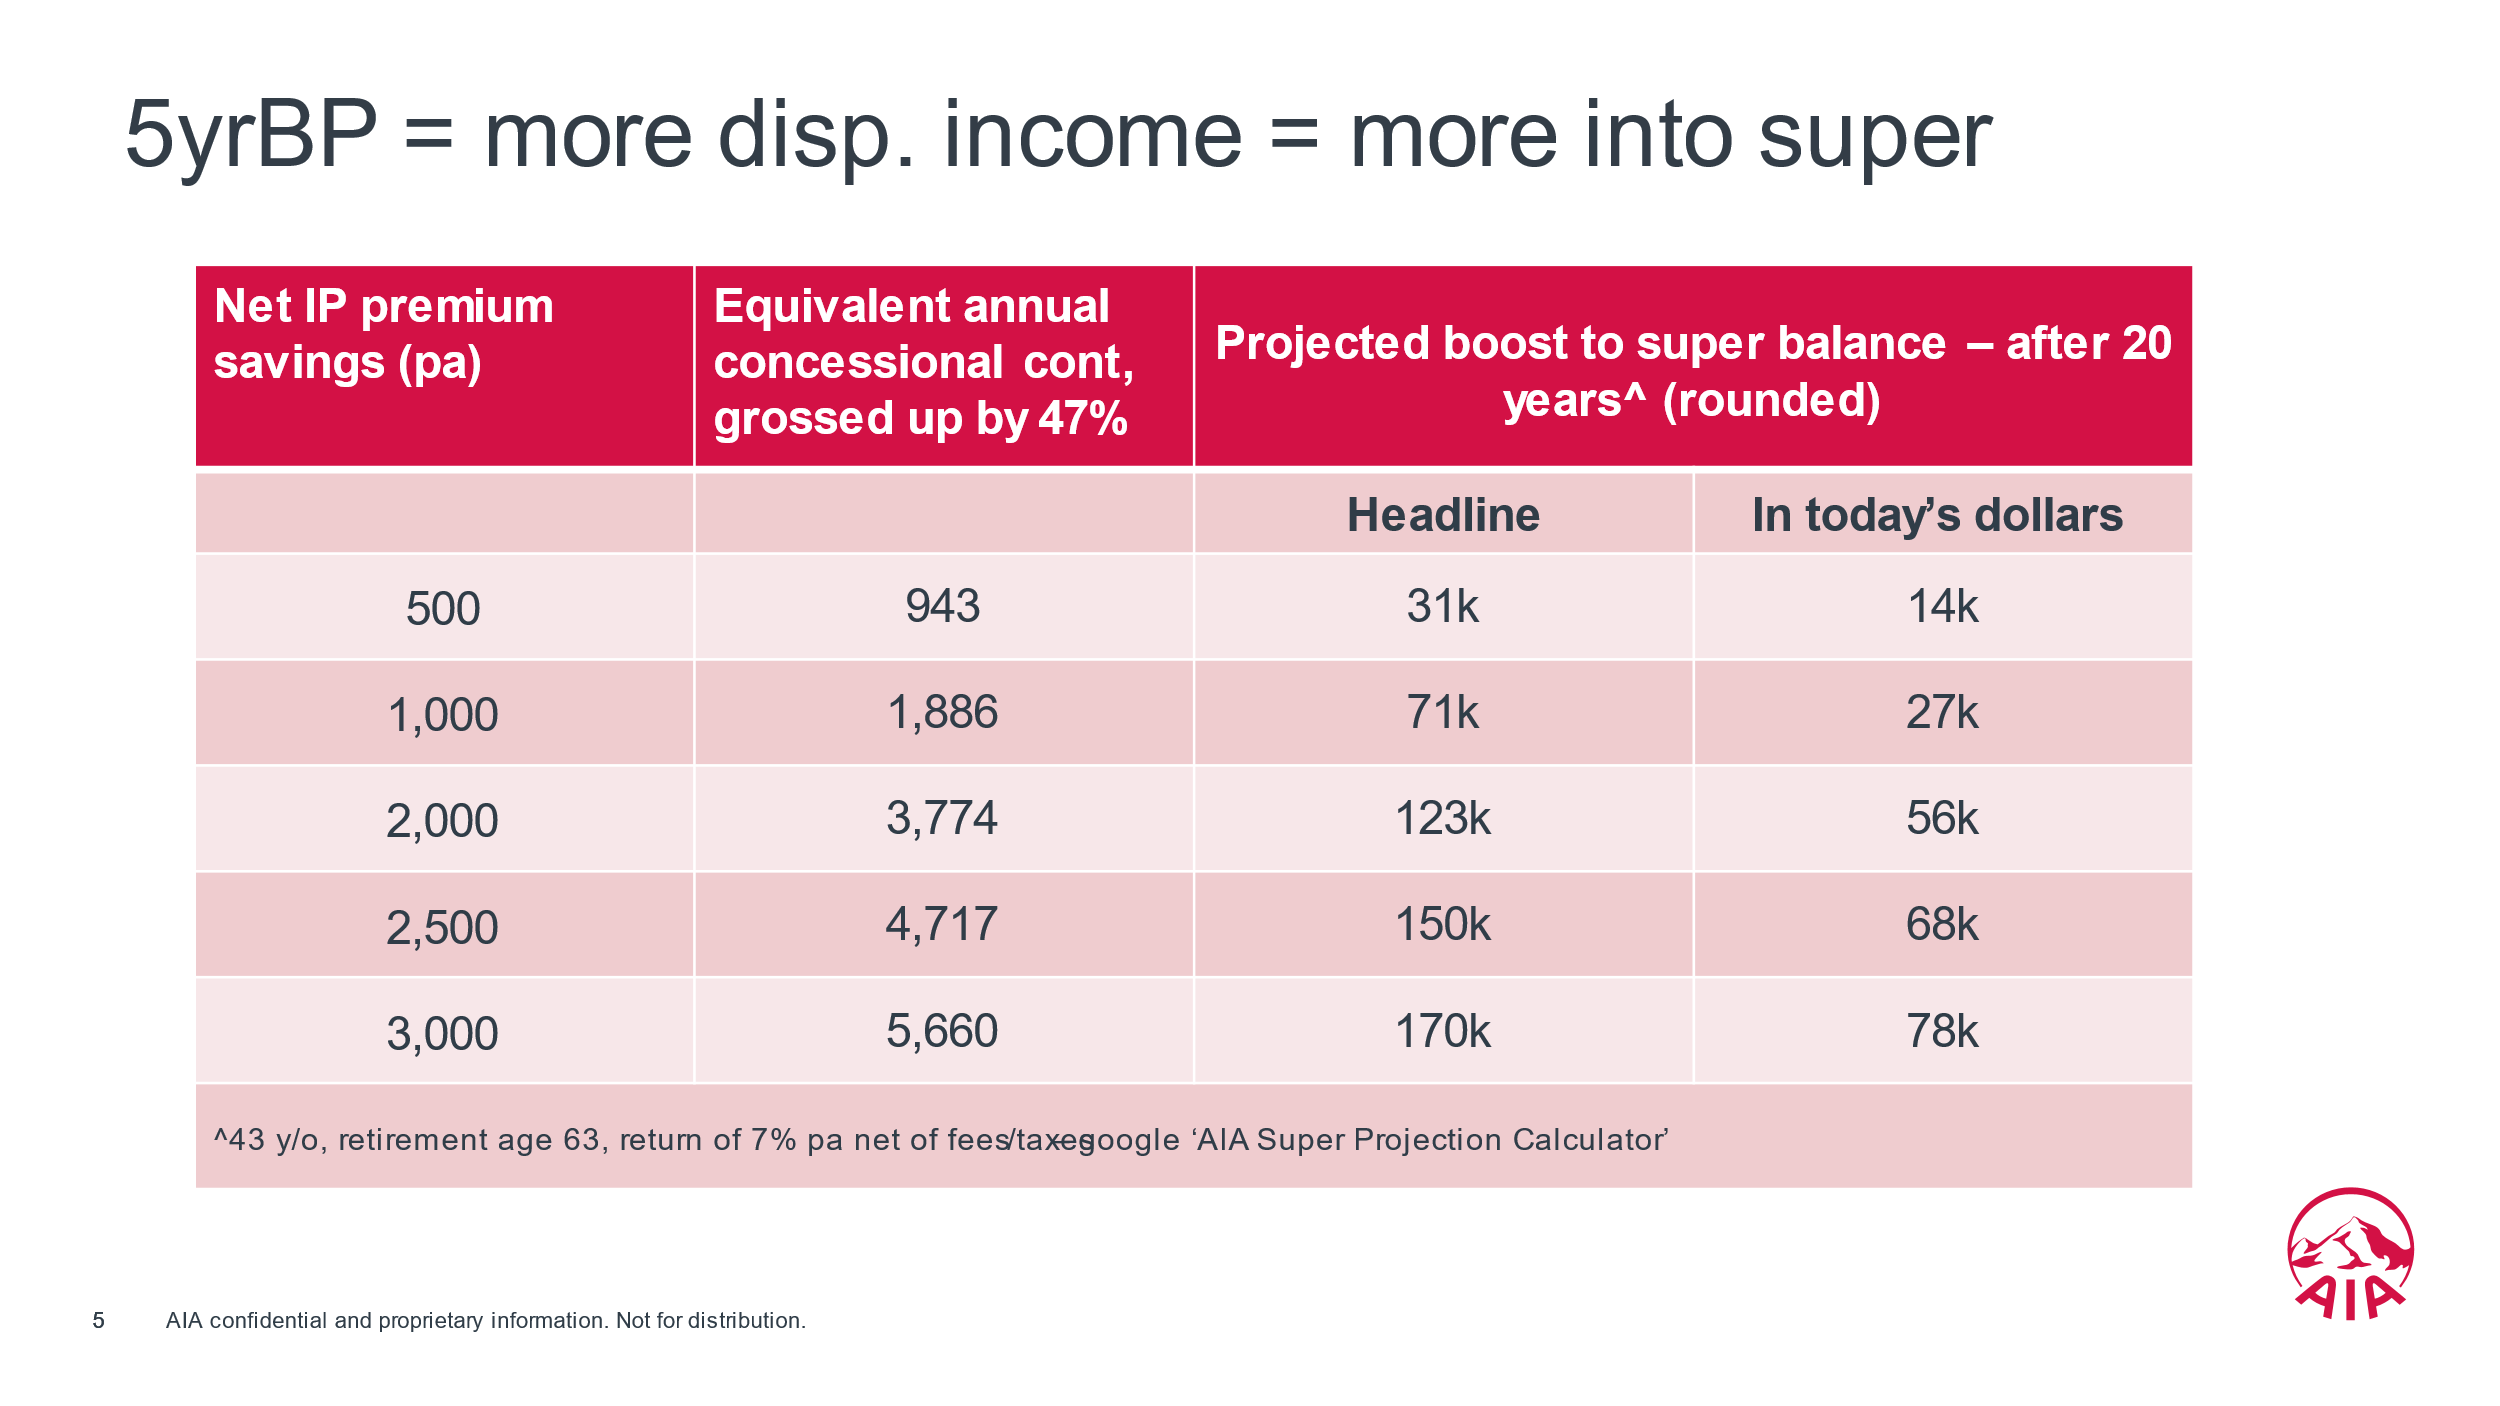
For clients that have significantly reduced or erased their mortgage debt, the extra annual disposable income creates additional cash flow to accumulate wealth and indeed contribute into super, either for the client or their spouse, perhaps in accordance with a spouse super fund equalising arrangement. These extra annual super contributions, capitalising on dollar-cost averaging, compounding with the tax concessional super environment, wouldn’t have otherwise been possible with the alternative of a TA65 IP policy. That is the opportunity cost of a TA65 IP policy for clients in this cohort. Table C illustrates the effectiveness of additional annual super contributions and the consequential projected boost to retirement savings over time.
In the end, there is no right or wrong answer. Some clients will tolerate the 3.6% chance, especially when viewed with their other goals, needs, objectives and current economic climate in mind. Others will not and will prefer the peace of mind a long-term benefit period provides, notwithstanding the opportunity cost of a more expensive annual premium.
Compliance – link with Standard 6
The Compliance Managers we’ve referred to emphasise the need to canvass both options (TA65 versus 5-Year Benefit Period) to the client, articulate their respective trade-offs, risk factors and opportunity costs, file note and document the outcome of that discussion, and then reinforce this in the SOA. That way the client is making an informed decision based on the various options available together with their respective trade-offs, considering their individual circumstances, tolerance levels, and broader family balance sheet. Indeed, this is what Standard 6 of the FASEA Code fundamentally requires.
Flipped on its head, the risk one runs in presenting just the TA65 option is the client complaining, at some stage down the track, that they weren’t presented with an option that could have saved them up to 65% in annual IP premiums.
TPD sum insured
We note that in many cases, Life, TPD, and Trauma cover are already being bundled together with the IP policy. To this end, with all else being equal, a shorter IP benefit period may necessitate a higher level of TPD cover. Determining the appropriate TPD sum insured in these circumstances fundamentally comes down to a Net Present Value calculation.
Case Study
To illustrate, assume your client is 43 years of age, earning a base income of $200,000 per annum. A 70% replacement ratio equates to $140,000 per annum. If the unforeseen were to occur and the client goes on claim today, and is still on claim after 5 years, the client will have turned 48, leaving another 17 years until they reach the age of 65. The Net Present Value of TPD cover required for a 17-year, $140,000 annual income stream is $1.8M, assuming a net return of 7% per annum on the capital and a 3.5% rate of inflation. That capital would of course be under the watch of the adviser and invested in accordance with the firm’s investment philosophy and asset allocation approach, with the aim of generating income and capital growth.
Support and Tools
We advocate for all options to be proposed, and for robust client discussions to take place using client goals and objectives as the foundation, especially with the prospect of further interest rate rises on the horizon and sustained cost of living pressures.
To support this process, visit our Technical Resources page to access a one-page matrix that outlines the pros and cons of each benefit period option that can provide a framework for client discussions and simultaneously transition to the file note for record keeping purposes. Additionally, the net present value calculators and SOA text may support recommendations for both long and short benefit periods.
Reach out to your AIA Client Development Manager or Associate if you would like more information or need help generating a quote for your client illustrating both options mentioned.
This information is intended for financial advisers only and is not for wider distribution. This information is current at the date of distribution and is subject to change. This is general information in summary only, without taking into account the objectives, financial situation, needs or personal circumstances of any individual, and may not be exhaustive. It is not intended as financial, legal, taxation, medical or other advice.
Table A-1 – Difference in annual premiums – TA65 v 5yr BP (White Collar)
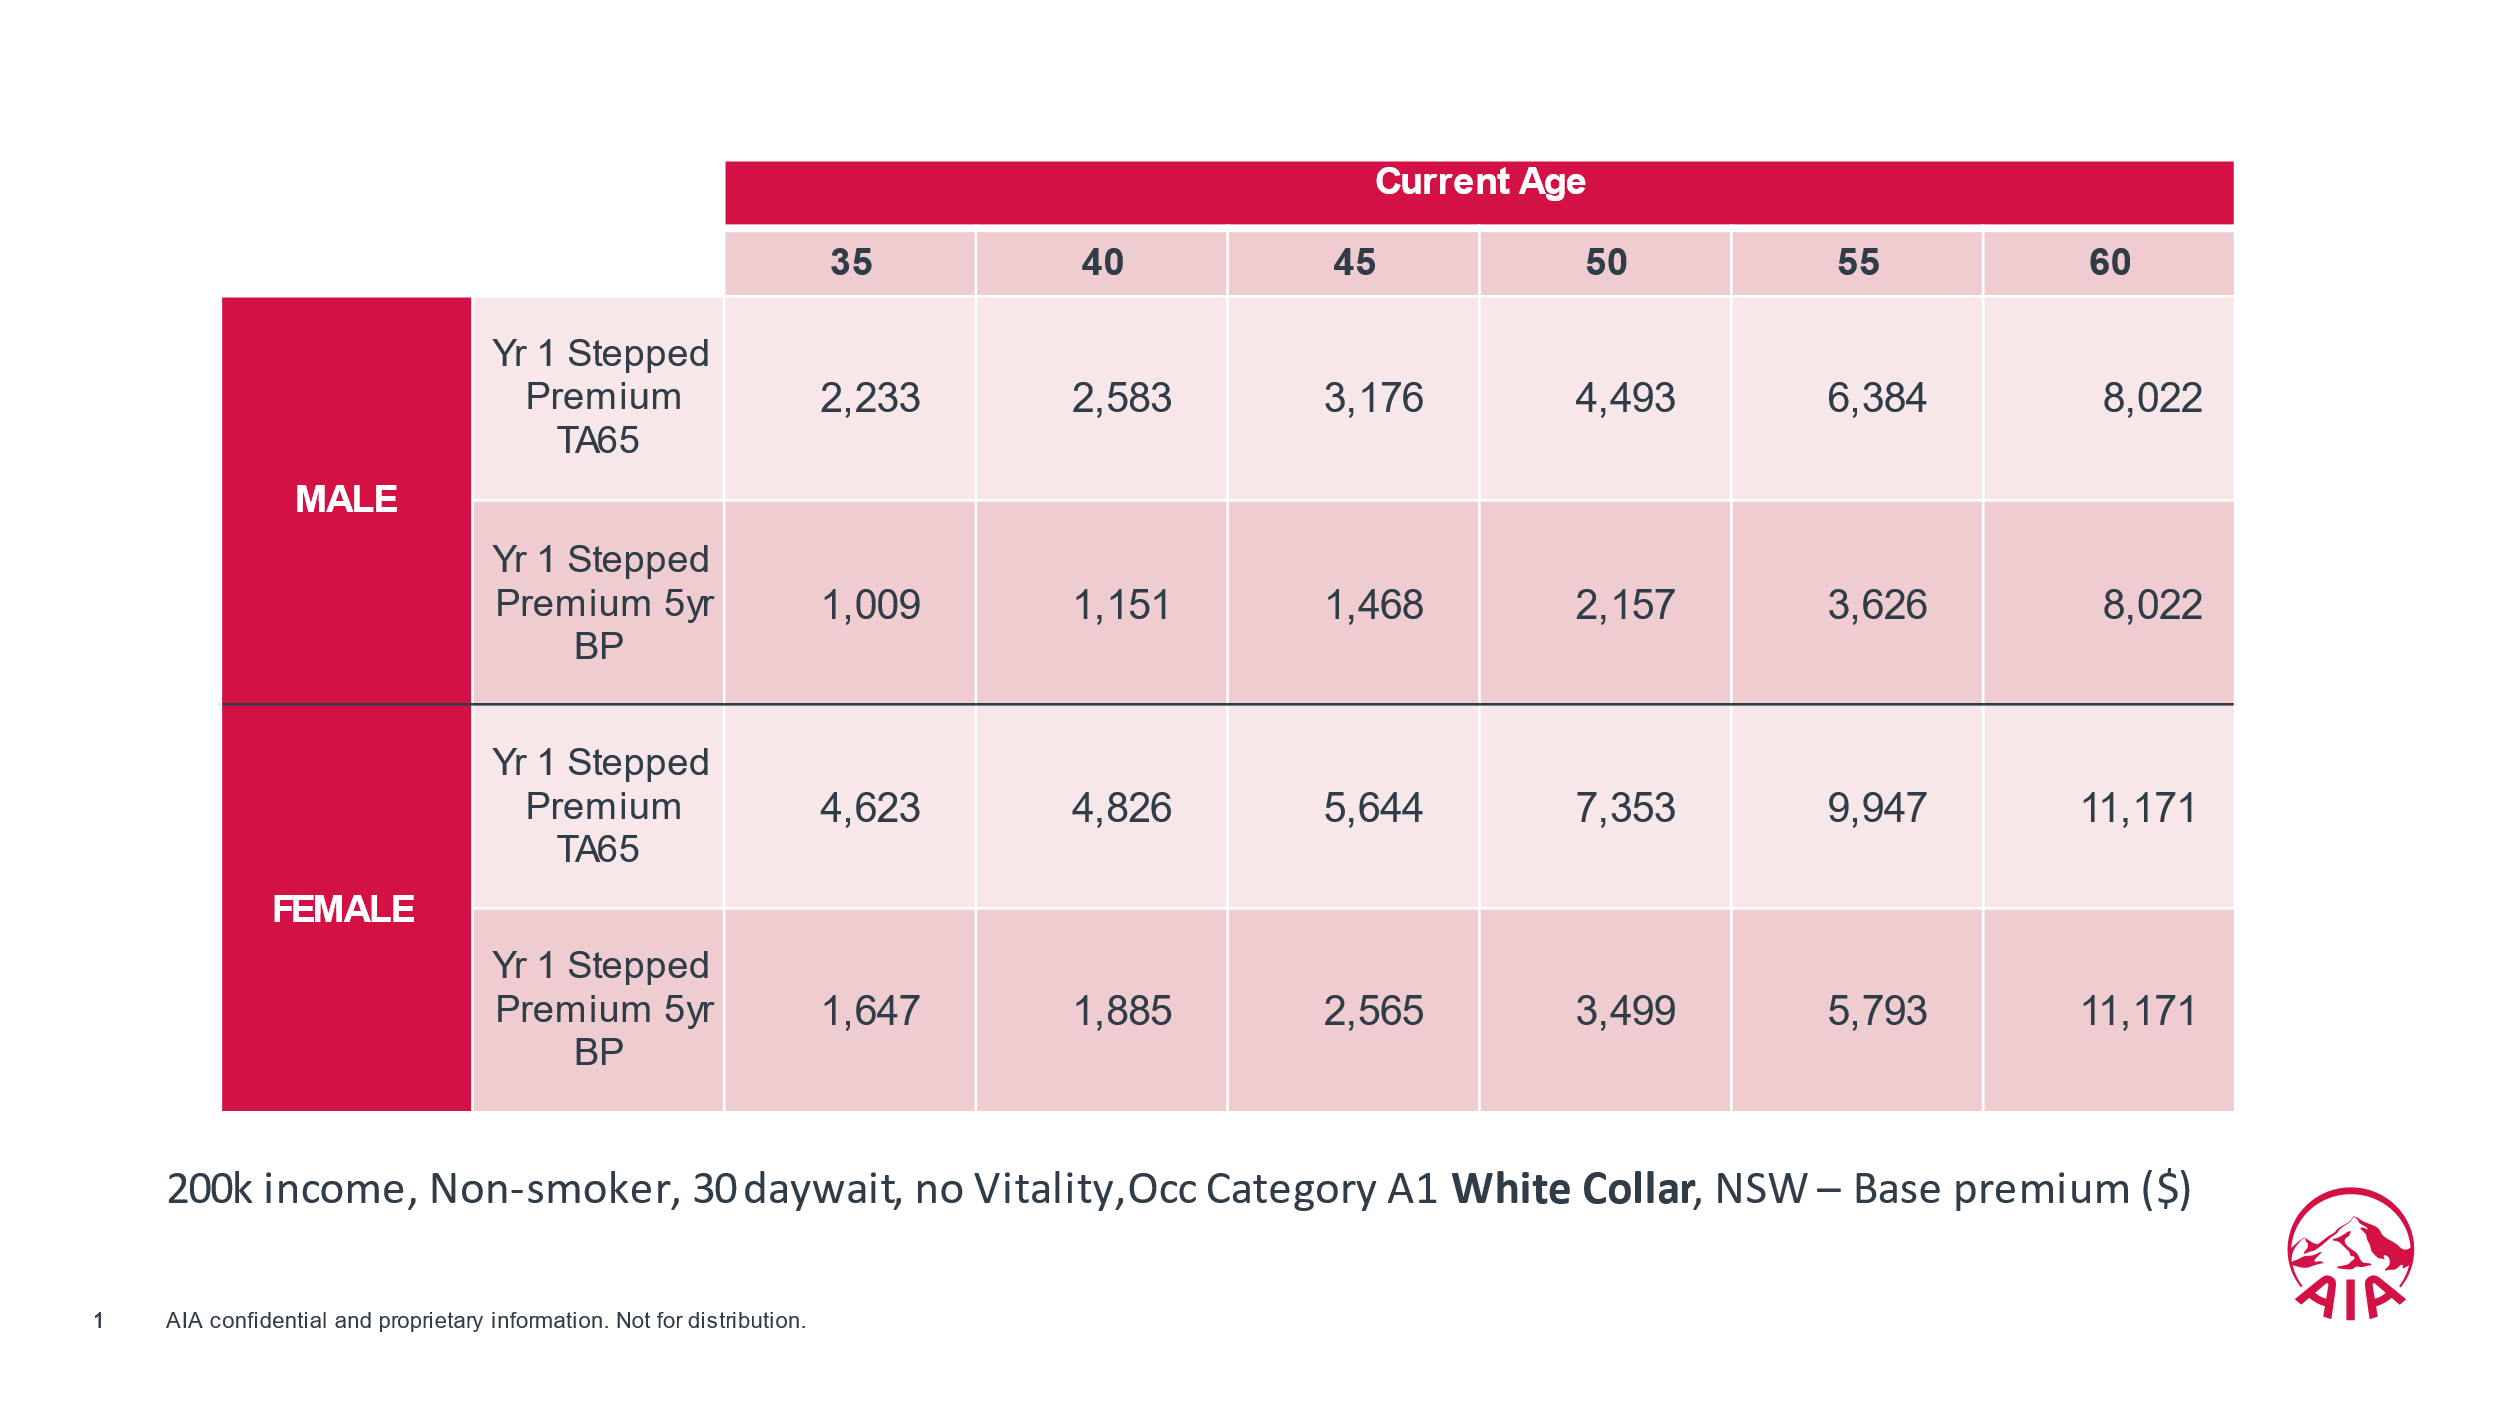
Table A-2 Difference in annual premiums – TA65 v 5yr BP (Blue Collar)
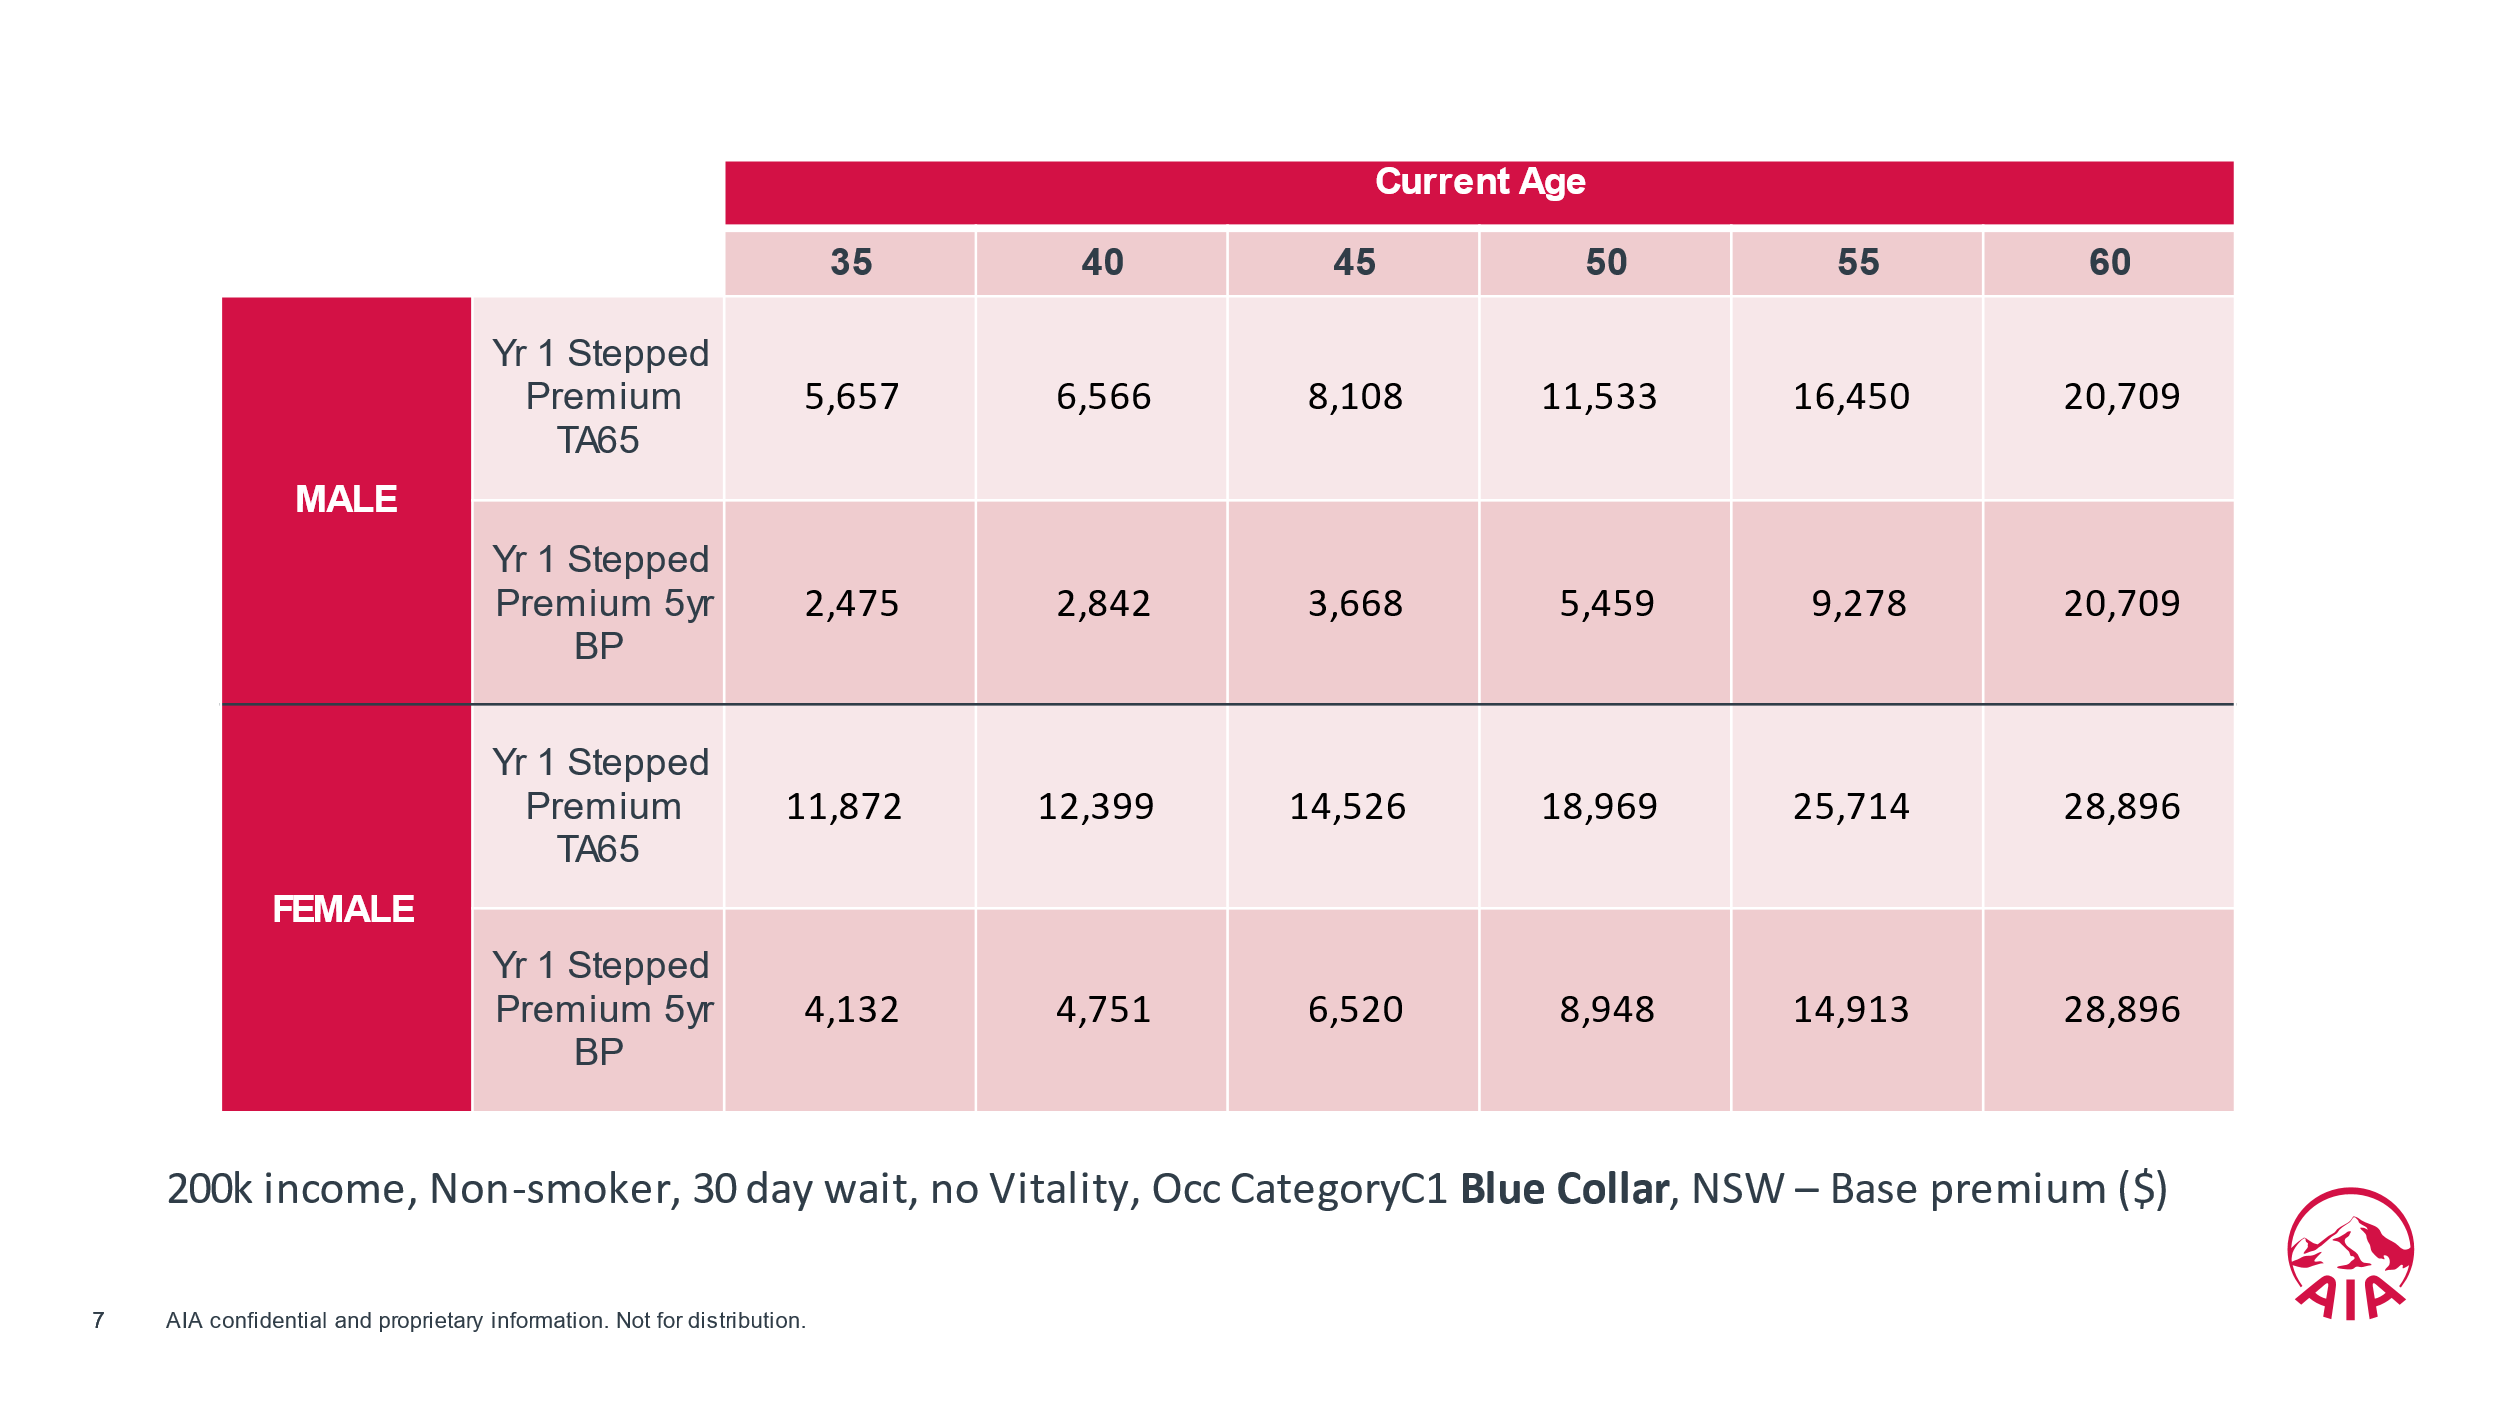
Table B – 5yr BP creates more disposable income, which could enable extra annual repayments on home mortgage and lower amounts of non-deductible interest…
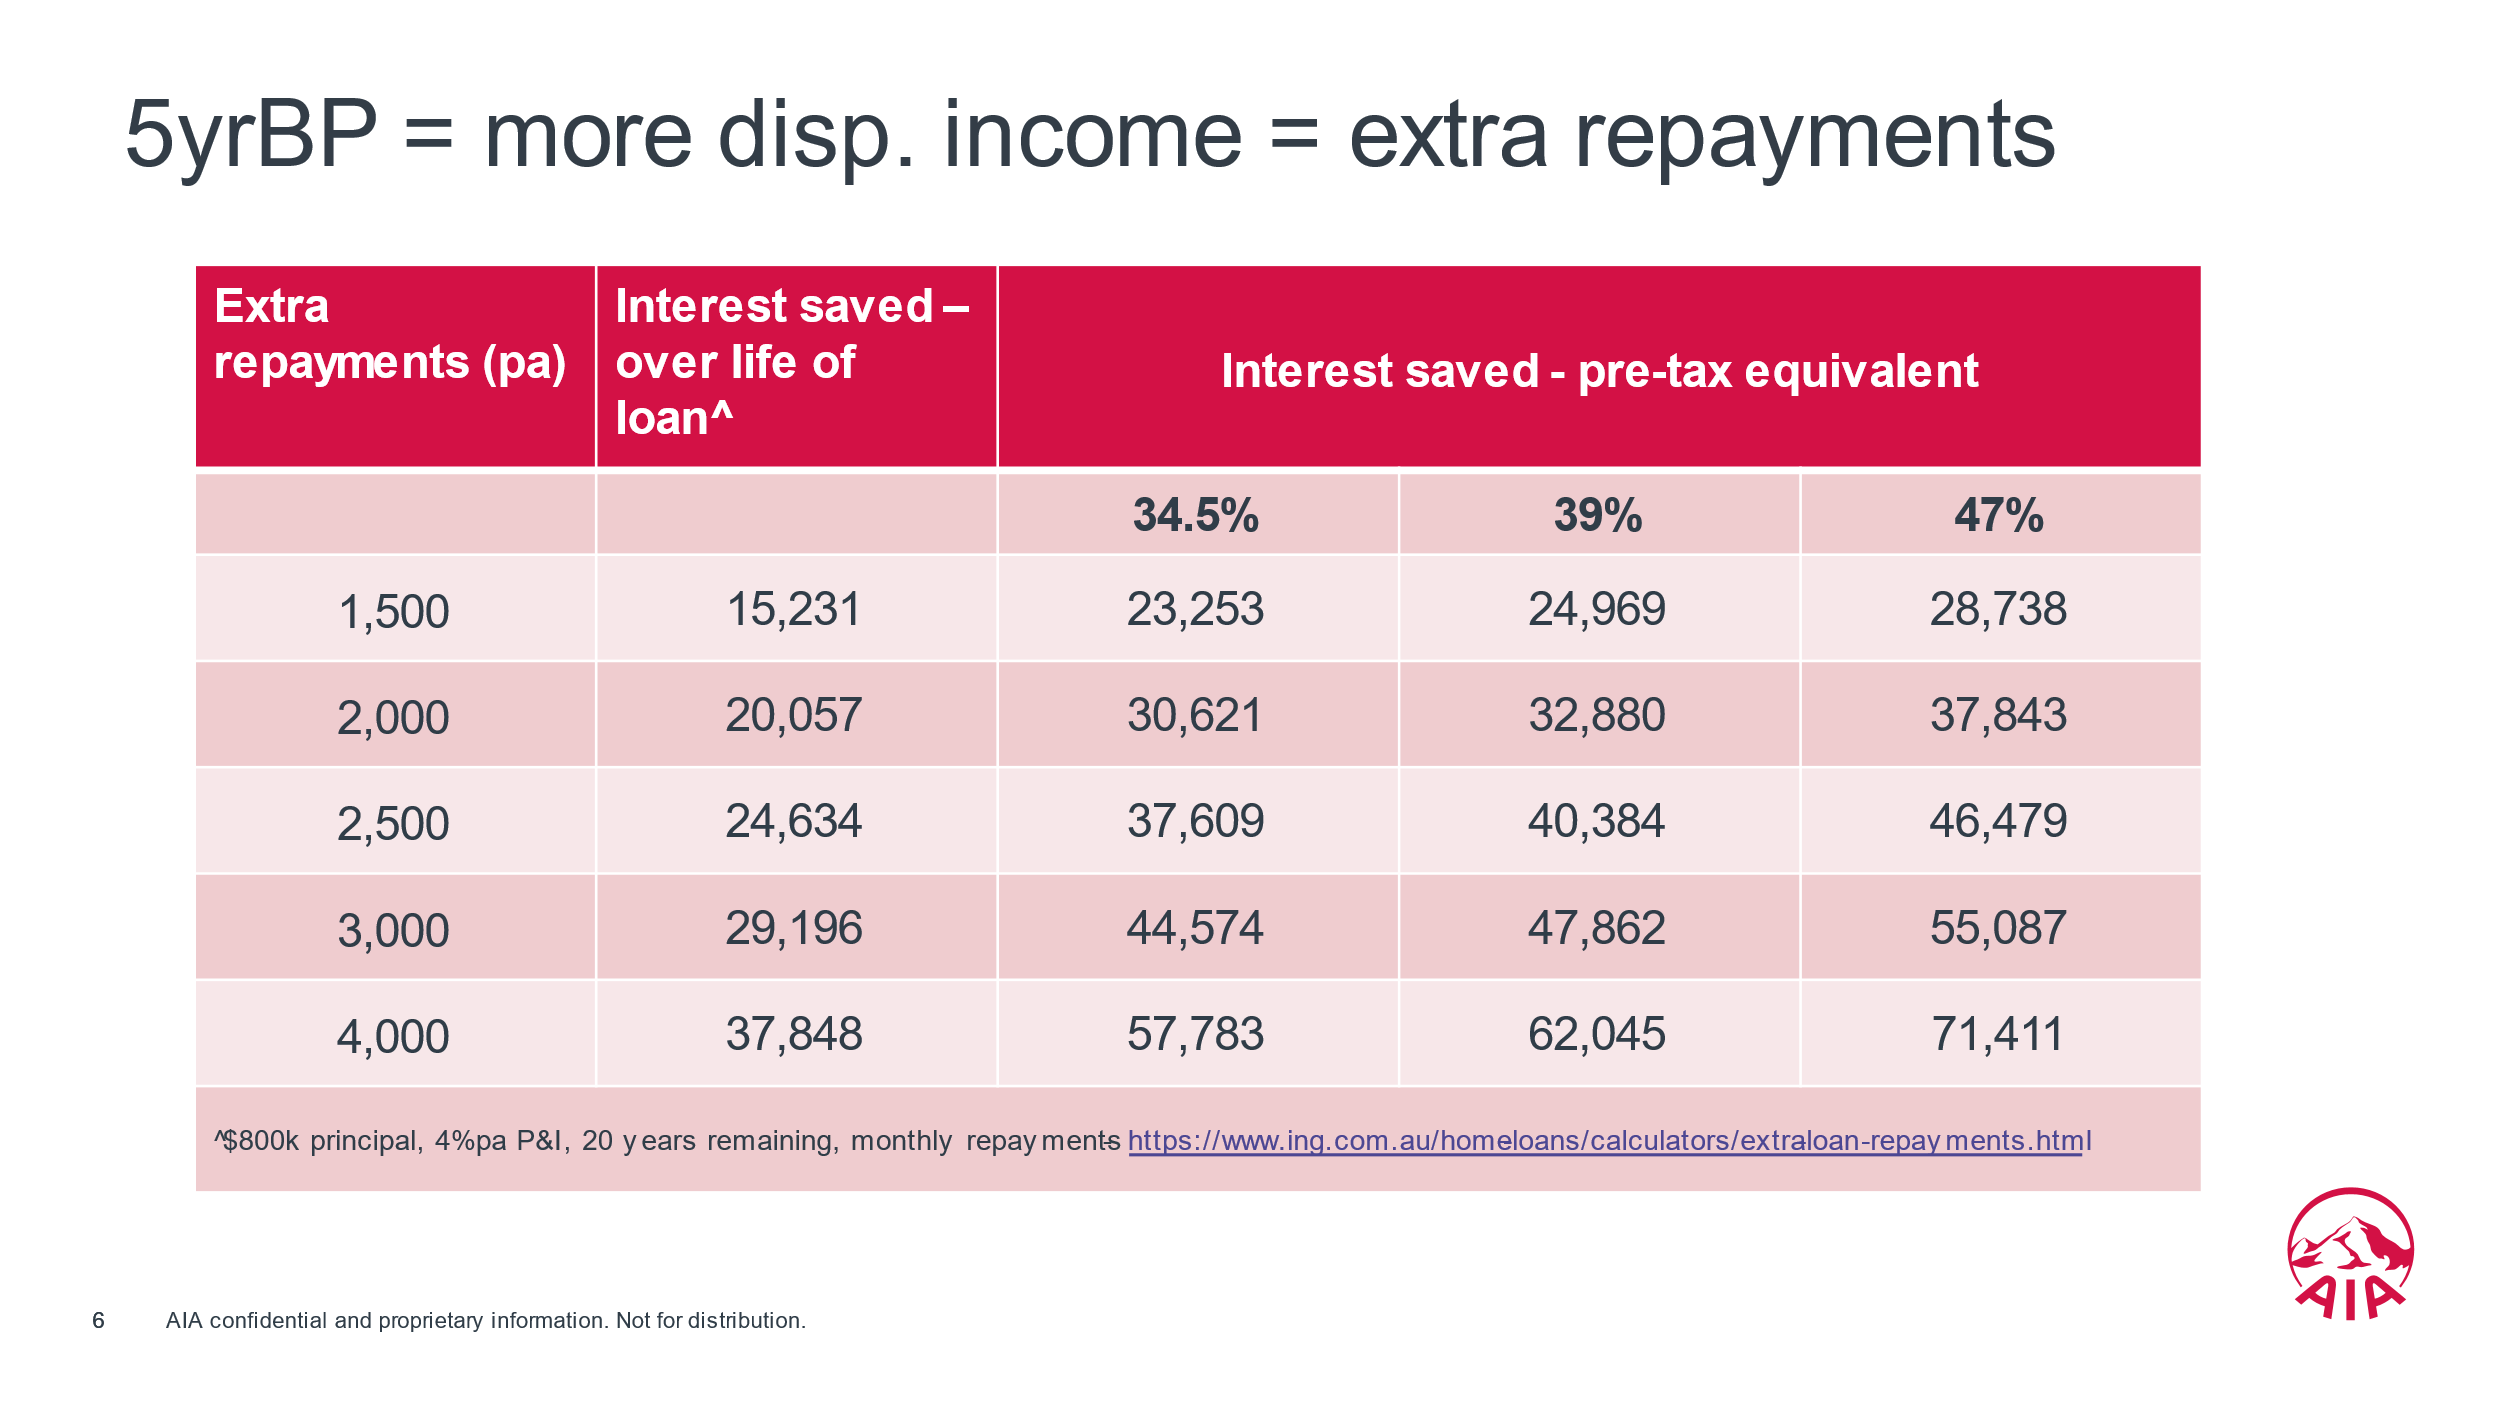
Table C – 5yr BP creates more disposable income, which could enable extra annual superannuation contributions….