This is Part III of the series Behind the Behaviours: Using Revealed Preferences to Understand What Clients Can’t Tell You
Risk profiling is often one and done – since it’s treated as a compliance “tick the box” formality. But the research suggests it’s worth a revisit.
Let’s briefly try a simple thought experiment: imagine two general practitioners (GPs) and how they do annual checkups for their patients.
One GP asks questions about how you’re feeling, takes your weight, sizes you up, and if everything seems to be going ok, sends you on your way.
The other GP does all that AND takes your blood pressure and does blood tests. She then calls you to step through the results and shows you visually how your blood markers are trending over time. She notices a tick down in your “good” cholesterol, and that prompts her to dig deeper with you on any subtle changes in your eating and exercise habits. Her office calls you up a few months later to check your cholesterol again.
Which GP’s annual checkup engenders more trust and confidence?’
Most would say GP #2. By a country mile.
Reprofiling pays off
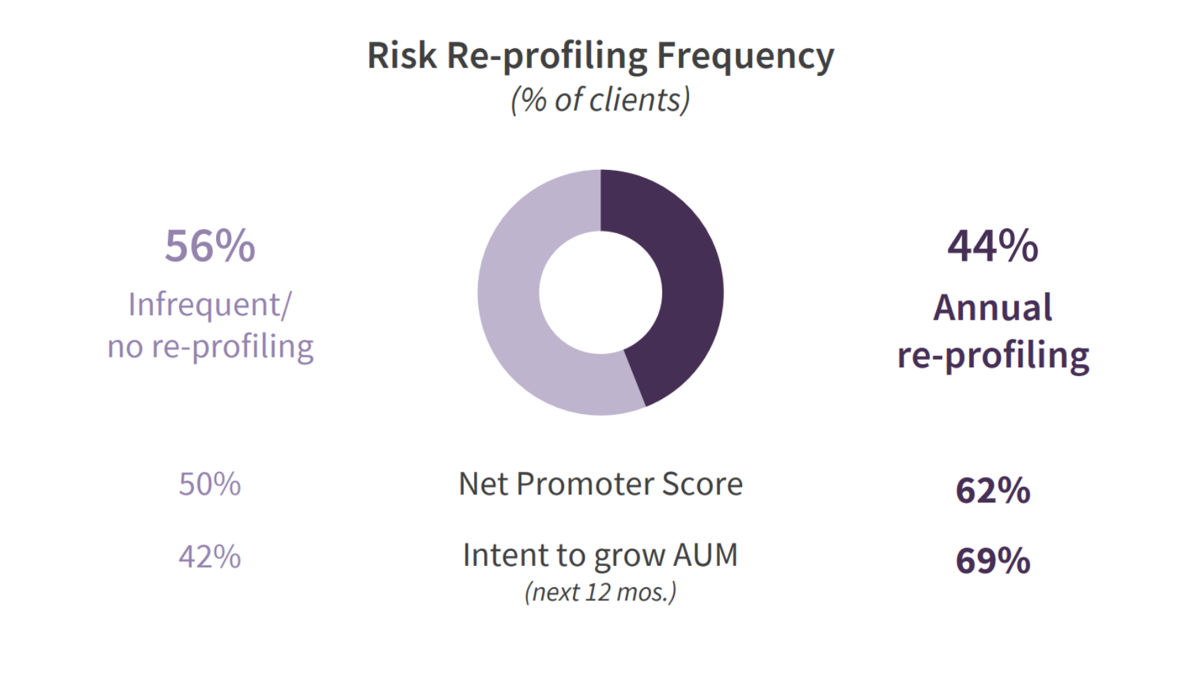
Switching to an advice context, a majority of clients report their adviser is more like the first GP than the second. Only 35-45% of clients report being risk profiled annually, according to studies conducted in 20181 and 20222. For the majority of clients (55%-65%), it’s only every few years that their adviser re-profiles their risk preferences. And one out of eight clients report never being risk profiled again after onboarding.3
It seems to matter, too. Clients who are re-profiled annually are more likely to recommend their adviser — their Net Promoter Score (NPS) averages over 10 points higher than those who are risk profiled less frequently. And they are much more likely to intend to grow AUM in the ensuing 12 months – 69% vs. 42%.4
It makes sense, right? These clients feel more confident and have higher trust, just like patients of GP #2.
Why don’t more advisers risk profile annually?
Behind closed doors, many advisers will tell you risk profiling is a tick-the-box exercise done at the front end of advice relationships, and seldom thereafter. It’s one-and-done with the old risk tolerance questionnaire (RTQ), which is what 90%+ of advisers use.
Among the reasons they give:
• The multiple-choice question format feels clunky – revisiting those questions every year with a client feels painful and just repetitive. Clients already told you how they reacted in the last recession, why would you need to ask the same question again?
• Pen-and-paper + questionnaire length feel behind the times – they just don’t come across as modern for today’s client, who is online and has a short(ening) attention span. Even when RTQs are “digital”, the format feels dated.
• Limited visualisation – RTQs don’t have a natural, compelling way of showing a client how their risk preferences are changing over time. They aren’t like modern patient portals that can chart your vitals and lab results over time.
• Methodologically flimsy – many RTQs were created “in-house” with little rigour.
The thought of re-profiling clients every year with conventional RTQs just feels like too much squeeze for too little juice.
Changing the re-profiling value proposition
Recent advances in client preference measurement change the value equation. Revealed preference methods are a compelling example.
As a reminder from Part I of this series, revealed preference methods combine standard and behavioural economics with decision science and gamified experiences. They are not questionnaires. Rather, they let us precisely measure preferences through a client’s decisions, so we can detect hidden wrinkles in their preferences that clients couldn’t express themselves, and that no questionnaire could pick up.
How do revealed preferences change the re-profiling value equation?

Let’s start with the client experience.
• Quick & intuitive – revealed preferences are speedy, with most clients completing six decision scenarios in about two minutes.
• Mobile-native – clients can engage wherever they are in their daily routine.
• Decision scenario-based – clients think more deeply about the risks they are willing to take, compared to multiple choice questions. It’s more cognitively engaging.
In other words, asking a client to re-profile doesn’t feel like a chore. In medical terms, it’s the equivalent of taking a patient’s blood pressure – quick and easy.
Sample revealed preference decision-
We’ve used our own tool to illustrate this. In the example shown, clients make a trade-off decision on a series of risk-reward scenarios by moving a slider to choose their preferred point.
Now think about the adviser perspective, where establishing an initial benchmark and routinely re-profiling is a chance to create value and show the work.
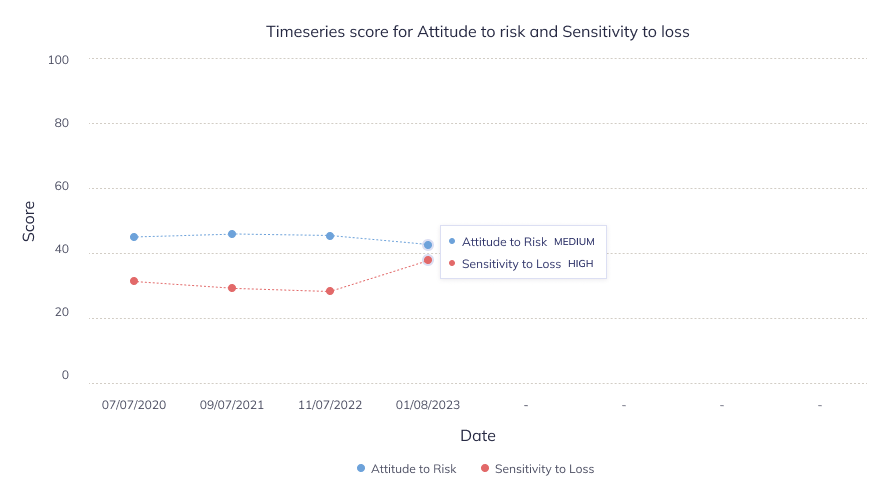
Show visualisations – revealed preference methods measure specific preference dimensions (e.g., risk tolerance, loss aversion) that have a mathematical definition in economics. They can be plotted on a chart to see how they change over time. This opens the way to powerful teaching conversations with clients – much as a GP would speak to a patient about trends in their annual blood panel.
A note about changing preferences:
Client risk preferences are generally stable. However, they can change due to macroeconomic shocks (e.g., inflation spikes, market volatility spikes) and life events (e.g. expecting a first child; job insecurity).
Shachar Kariv, Professor and former chair of the economics department at University of California at Berkeley and Chief Scientist of Capital Preferences, explains what causes preferences to change over time.
Detect hidden preference movements – in some cases, clients can’t self-report their changing preferences. For example, many clients simply won’t be tuned into their changing loss aversion. In other cases, clients don’t want to self-report, such as in the case of job insecurity or a family illness.
Advisers may detect a movement in risk preferences before the client realises the source of the change. It gives the adviser a chance to stay ahead of clients – changes in their preferences will come with changes in their behaviours.
Create more “surface area” to deliver value – detecting a hidden uptick in client loss aversion, for example, not only leads to a teaching moment, but provides a strong rationale for exploring insurance, guaranteed income and other products built for the loss averse. It’s a central part of delivering suitable advice and products to clients.
Meeting a higher standard of understanding clients
You can see the parallels between advice and medicine here. Adopting a systematic preference re-profiling approach with clients is equivalent to GP #2’s approach in the opening thought experiment. She’s routinely re-measuring blood pressure and blood markers against an initial benchmark for each patient. It helps her stay ahead of hidden patient problem areas, teach the patient about their own wellbeing, and identify more personalised treatment paths that are tailored to the patient’s changing circulatory conditions.
Ultimately, it’s a duty of understanding patients. The rigour of understanding is foundational to the way that physicians create value and show the work for their patients.
Why should advice be any different?
In part IV of this series, we’ll look at sustainable investing, and how to approach preference measurement when most clients don’t even know on what dimensions they could have preferences.
You can access more information on how revealed preferences can be used within your business and with clients here.
1. State of Client Understanding Study, Capital Preferences, 2018. n = 423 adviser respondents
2. Not-So-Odd Couples: Creating an Equitable Advice Experience for Modern Couples, Capital Preferences, 2023, n = 387 client respondents
3. Ibid.
4. Ibid.
